2015 Remote Sensing Project


Discssion
For the Radar data, PALSAR and SIR-C, the buried channel with higher moisture content would appear brighter in the image so I just look at the image and try to find any subsurface structure related to any indication about the buried channel. However the result from processing isn’t good enough, although the filters can remove the speckle noting can be found in it. The only feature found in the PALSAR data is the tributary stream, marked by the red line (Fig.3.). I think this may because the sand dunes in this area are too thick, several meters high, so that the subsurface features are hard to recognize.

Fig.3. PALSAR image shows the trace of distributary stream in Thar Desrt, India. (L-HV)
Radar data is a good option to look at the subsurface features but it seems doesn’t work very well in this case and therefore I started to look at the Landsat data trying to use the surface feature to find out the possible buried channel.
In the optical sensor image, as soil moisture increases, reflectance of soil decreases at all wavelengths and therefore the darker pixel in the image may be a good start (Fig.4.). This surface feature sometimes is hard to recognize in the true color composite image, with decorrelation stretch it is easier to distinguish (Fig.5.).

a.

b.
Fig.4.a.b. Landsat 8 true color composite image shows the indication of paleo channels in Thar Desert, India.

a.

b.
Fig.4.a.b. Landsat 8 decorrelation stretched image shows the indication of paleo channels in Thar Desert, India. (RGB: NIR, SWIR1 and SWIR2)
In the desert area sand dunes and saline lakes are the most identical features so I mainly focus on these two surface features to do the interpretation. The micro-geomorphic anomalies, Corn-Cob structure can help to identify the paleo channels as it appeared within and outside the channels. Corn-cob structures are formed due to deposition of sand over a flowing water body, the flowing water tries to remove depositing sand load to the best of its capacity, as a result a different kind of dune pattern consisting of normally much smaller dunes in larger dune fields are formed along the existing water bodies, on imagery these appear like scattered corn grains resembling a corn-cob feature (Gupta et al., 2004) (Fig.5.a.b.). This feature is a matter of texture and pattern not the difference in reflectance and so far I couldn’t find any method to do the classification according to that.

a.

b.
Fig.5.a.b. Corn-Cob structure in Landsat 8 true color composite image in Thar Desert. India.
While examining the patterns of the sand dunes, it can be seen that there are some anomalies in lineation and this may be an indication of the paleo channel that disturbed the arrangement of the sand dunes (Fig.6.).
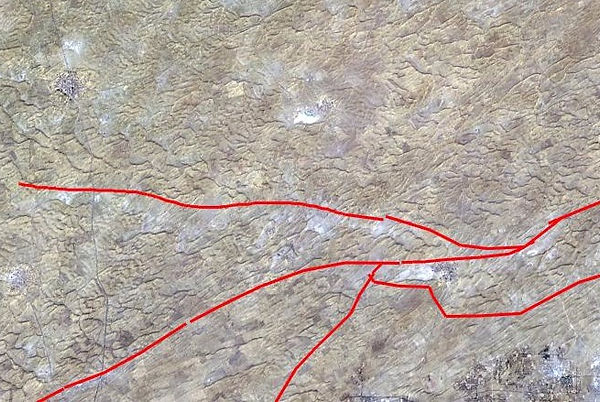
Fig.6. Landsat 8 true color composite image shows the anomalies in sand dunes in Thar Desert. India.
Saline depressions in western Rajasthan are geomorphologically similar to playa lakes which are broad and shallow depressions occasionally getting inundated with water. Majority of saline lakes in Rajasthan were used to be dominated by rivers and then the drying channel couldn’t prevent the formation of the sand dunes and therefore formed a lake by impounding river water (Roy, 1999) (Fig.7.). So the saline lakes are another good indication of the paleo channels.

Fig.7. Saline lakes in Landsat 8 true color composite image in Thar Desert. India.
SRTM is used to see the topography and through it, there are scarps can be seen (Fig.8.) as well as the valley between a pile of sand dunes (Fig.9.) while these also can suggest the possible paleo channel.

Fig.8. SRTM image shows the scarp in Thar Desert, India.

Fig.9. SRTM image shows the trough in Thar Desert, India.
Fig.10. shows the result of integrating different approaches the blue line is current Gaggar-Hakra River and the red line is suggested trace of paleo channel according to the analysis mentioned above. The red line represents the surface features mapped from true color composite image megenta line represents the features more obvious in decorrelation stretched image and the black line stands for the lineation in SRTM.

Fig.10. The result of mapping paleo channels in Landsat 8 true color composite image in Thar Desert, India.
Fig.12.Point 1
Fig.13.. Point 2

Plotting the result on the google earth map (Fig.11.) shows a clearer image and then with the pictures on google earth layers we can see the field images in present. It can be seen that there are abandoned ancient construction in the site point 1, 2 and 5 (Fig.12, 13, 14.) and this may indicate the ancient civilization and the once flourished cities. In site point 3 (Fig.15.) there is a well suggesting that there are under ground water and this may indicate that there was once a river flowing which is quite consistent with the result from satellite images which suggest that this site is in the buried channel. In site point 4 (Fig.16.) there is a lake in the Thar Desert which shows the same result as the satellite images.
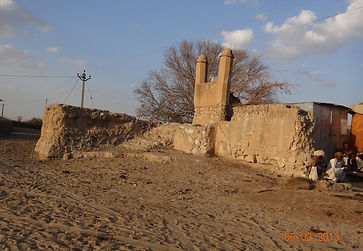


Fig.15. Point 5
Fig.11.
Fig.12. Point 1
Fig.13. Point 2


Fig.15. Point 4
Fig.14. Point 3
Fig.11. Plotting the track of paleo channel on googel earth map.
Fig.12, 13 and 16. Pictures in point 1, 2 and 5 of the google earth plot shows the abandoned ancient constructions in Thar Desert, India. (Resources: google earth)
Fig.14. Picture in point 3 of the google earth plot shows the well in Thar Desert, India. (Resources: google earth)
Fig.15. Picture in point 4 of the google earth plot shows the lake in Thar Desert, India. (Resources: google earth)